
RSI can be used for more than just overbought and oversold levels. Learn how to spot reversals in the Forex market using RSI divergence.
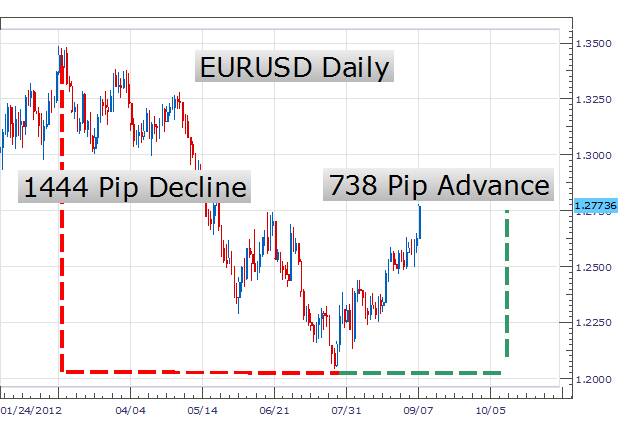
Many traders look to the RSI traditionally for its overbought and oversold levels. While using these levels can be helpful to traders, they often overlook points of divergence that is also imbedded in RSI. Divergence is a potent tool that can spot potential market reversals by comparing indicator and market direction. Below we have an example of the EURUSD turning 738 pips after concluding a 1444 pip decline on a daily chart. Could RSI help us spot the turn? To find out, let’s learn more about traditional divergence.
(Created using FXCM’s Marketscope 2.0 charts)
The word divergence itself means to separate and that is exactly what we are looking for today. Typically RSI will follow price as the EURUSD declines so will the indicator. Divergence occurs when price splits from the indicator and they begin heading in two different directions. In the example below, we can again see our daily EURUSD chart with RSI doing just that.
To begin our analysis in a downtrend, we need to compare the standing lows on the graph. In a downtrend prices should be making lower lows and that is what the EURUSD does between the June 1 st and July 24 th lows. It is important to note the dates of these lows as we need to compare the RSI indicator at the same points. Marked on the chart below, we can see RSI making a series of higher lows. This is the divergence we are looking for! Once spotted traders can then employ the strategy of their choosing while looking for price to swing against the previous trend and break to higher highs.
(Created using FXCM’s Marketscope 2.0 charts)
It is important to note that indicators can stay ov erbought and oversold for long periods of time. As with any strategy traders should be looking to employ a stop to contain their risk. One method to consider in a downtrend is to employ a stop underneath the current swing low in price.
---Written by Walker England, Trading Instructor
Follow me on Twitter at @WEnglandFX.
To be added to Walker’s e-mail distribution list, send an email with the subject line “Distribution List” to WEngland@FXCM.com .
Want to learn more about trading RSI? Take our free RSI training course and learn new ways to trade with this versatile oscillator. Register HERE to start learning your next RSI strategy!
DailyFX provides forex news on the economic reports and political events that influence the currency market. Learn currency trading with a free practice account and charts from FXCM.
DailyFX provides forex news and technical analysis on the trends that influence the global currency markets. Learn forex trading with a free practice account and trading charts from FXCM .
Subscribe now for unlimited access.
$0/
(min cost $0)
or signup to continue reading

